
Warning: this project was carried out by the founder of Naes as an independent consultant and is listed here as a reference project on the Drupal platform.
The Client: Food and Agriculture Organization of the United Nations (FAO)
The Food and Agriculture Organization of the United Nations (known as FAO) is a specialized organization of the United Nations system, created in 1945 in Quebec City.
Its supreme stated objective is "To help build a world free from hunger", its motto, inscribed on its logo, is "Fiat panis" (Latin expression meaning "that there is bread (for all)").
FAO helps countries create an enabling environment to improve and increase investment in food security, nutrition, agriculture and rural development, increase incomes and safeguard (or protect) the environment.
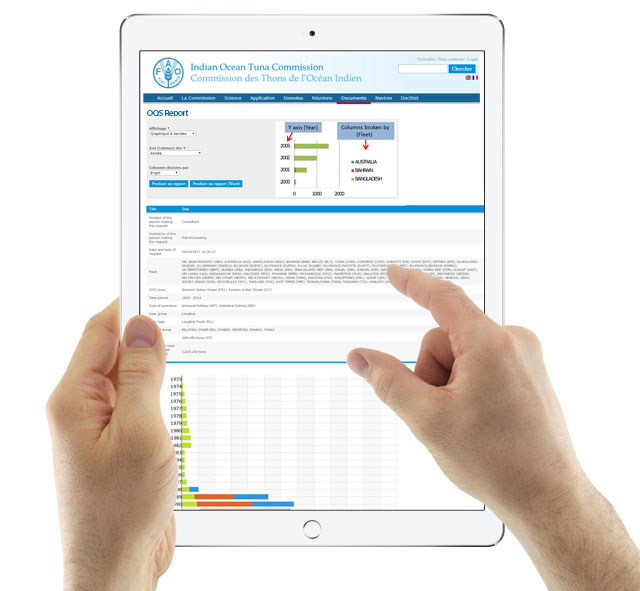
The problem: to have a tool for analysis and graphical rendering of catch data from 1950 to today
Monitoring the status and evolution of marine species stocks and collecting, analysing and disseminating this scientific and statistical information is FAO's role and commitment at the international level. These data are necessary for the conservation and management of stocks and fisheries covered in the Indian Ocean of threatened species.
For FAO, the design and development of a web application to help them analyze this public data in open-data and allow its use and sharing in scientific publications was therefore essential.
This web application must be capable:
- to query raw catch and artisanal fishing data dating back to the 1950s from 43 different countries;
- to be able to filter this data by fleet, geographical area, year or type of activities, gear groups or gear types or species groups;
- to be able to know as soon as the selection is made the number of results in his search;
- to be able to cross-reference these data;
- to propose the downloading of the results in the form of CSV or XLS;
- to perform sophisticated graphical rendering of these same query results in the form of tables, sectors (pie chart), line graphs, bar graphs or in cartographic and geo-localized form (soon);
- to produce structured reports in Word and PDF format containing key data with header and footer;
- to allow integration on an existing Drupal website;
- to be able to manage access permissions and users to this tool.
Some key figures on these data to be processed:
- 52 million processed catch data dating back to the 1950s;
47 fleets monitored worldwide, 380,000 artisanal or industrial fishing boats;
Statistics on 11 million tonnes of fish caught in the Indian Ocean each year.
The Naes answer: a module and an interface under Drupal to interface with SQL data
We started our work with an analysis and understanding phase of the data, and we also ensured their viability before handling them reliably. Indeed, it is absolutely essential to control its quality if we then want to be able to carry out calculation operations in order to extract analytics or reporting from it, whether tabular or graphical.
Once this phase was completed, development could begin. In this case, it was a question of coding different Drupal modules according to the rules of the art and recommendations in force and interfacing them with the search engine based on SolR and Drupal. The objective here was to be able to more easily use this data, export it and format it graphically directly in the web browser, as a Word or PDF document. This has facilitated the generation of written reports for researchers and scientists; and without the need for any third-party plug-ins.
This graphical generation of tables and diagrams was based on the choice of an open-source framework called pChart. Its advantage was its ability to meet the objectives of direct rendering in the form of a document intended for printing.
On the design side, the graphic model followed the one imposed by the theme of the site in place to host the application. The constraints were therefore high given the extremely large amount of data to be displayed.
The technologies used for this project:
- CMS / Framework Drupal 7
- LAMP server (Linux, Apache, MySQL, PHP)
- Framework jQuery, jQuery UI, pChart
Benefits for FAO
This new application is now used by research institutes, independent media and science journalists, fisheries ministries and fishing or processing companies.
It has immediate advantages, namely:
- A database that can be used directly online and updated regularly;
- A powerful tool for generating written (Word, PDF) or graphical (5 types of diagrams) analyses
- The ability to conduct precise and highly targeted research
- The flexibility of a Drupal solution with functional evolutions